 fermPlot
01 / Import
Start with your exports.
With an account, upload CSV exports and map columns to metrics and units. Ingestion runs as a background job, and the upload page shows each file’s status.
bioreactor_export.csv
Bioprocess data, plotted.
A web workspace for bioprocess data. Bring in CSV exports, explore process signals and assays, and compare your runs.
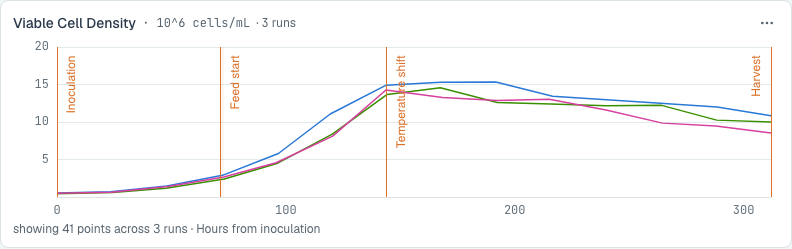
A complete run, in one plot.
MAB411-CAMP26-B24 · Durham GMP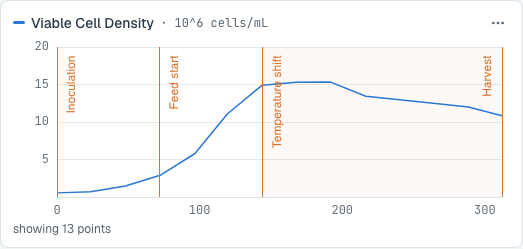
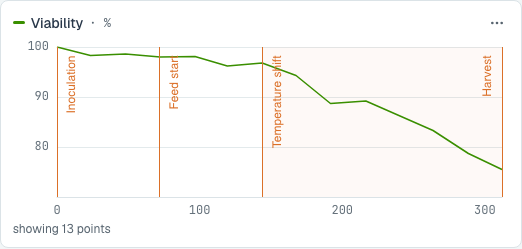
Explore growth, metabolites, process conditions and gases on a shared time axis. See run events alongside your measurements.
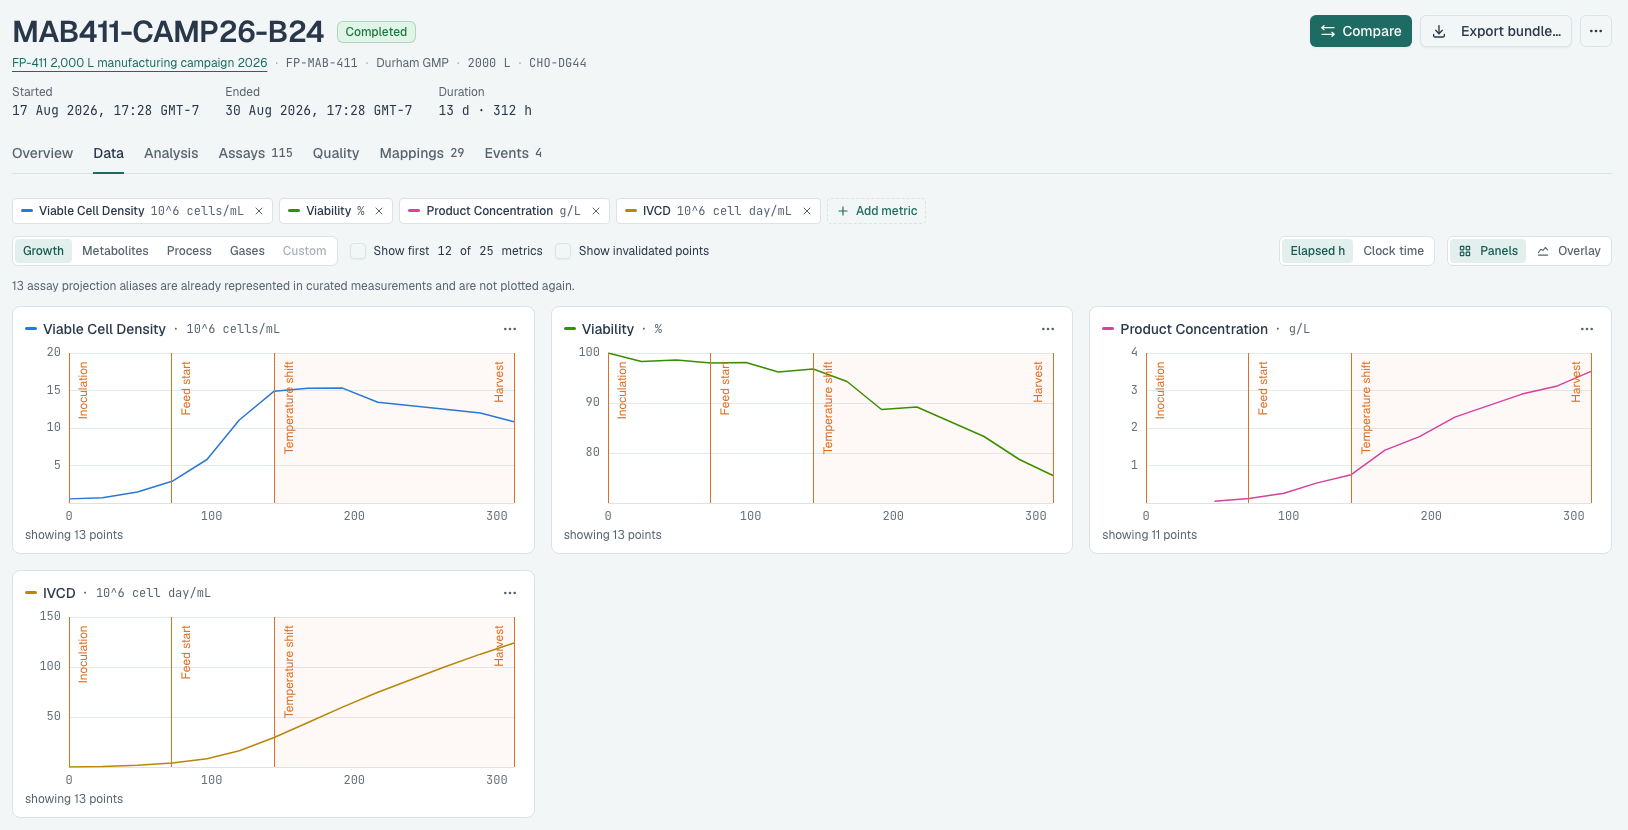
Screenshot detail · Open the full view above
Bring up to 12 runs into one comparison. Align their timelines, check unit compatibility and inspect a cohort summary.
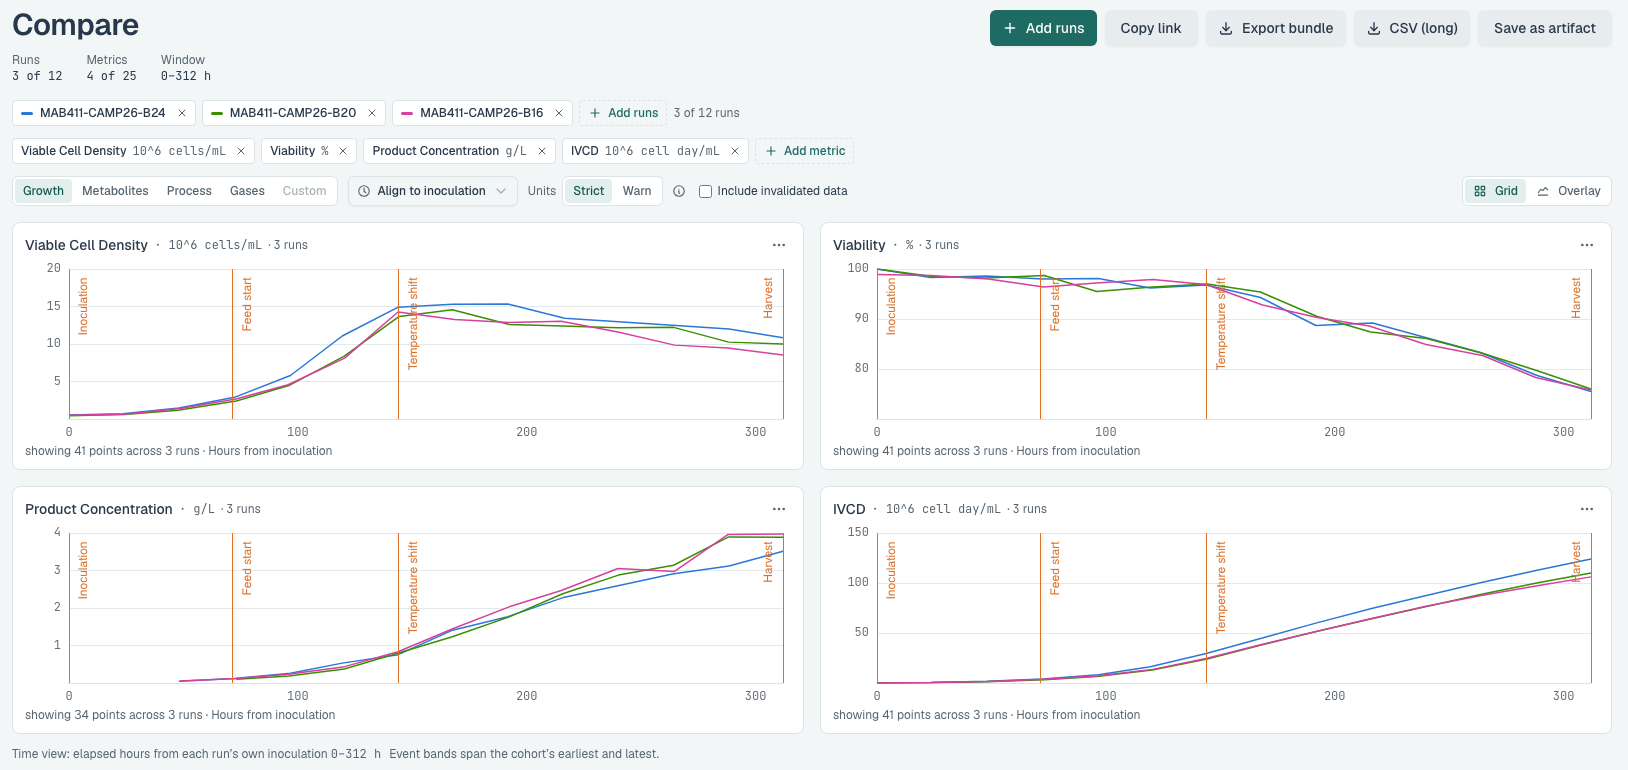
Screenshot detail · Open the full view above
Search and filter your run library by program, site and status. Group the table, add metric columns and export every run the filters match as one CSV. Each run shows its suspect and bad measurement counts and a growth trend. Filtering, sorting and paging run on the server, measured on a 1,000-run workspace.
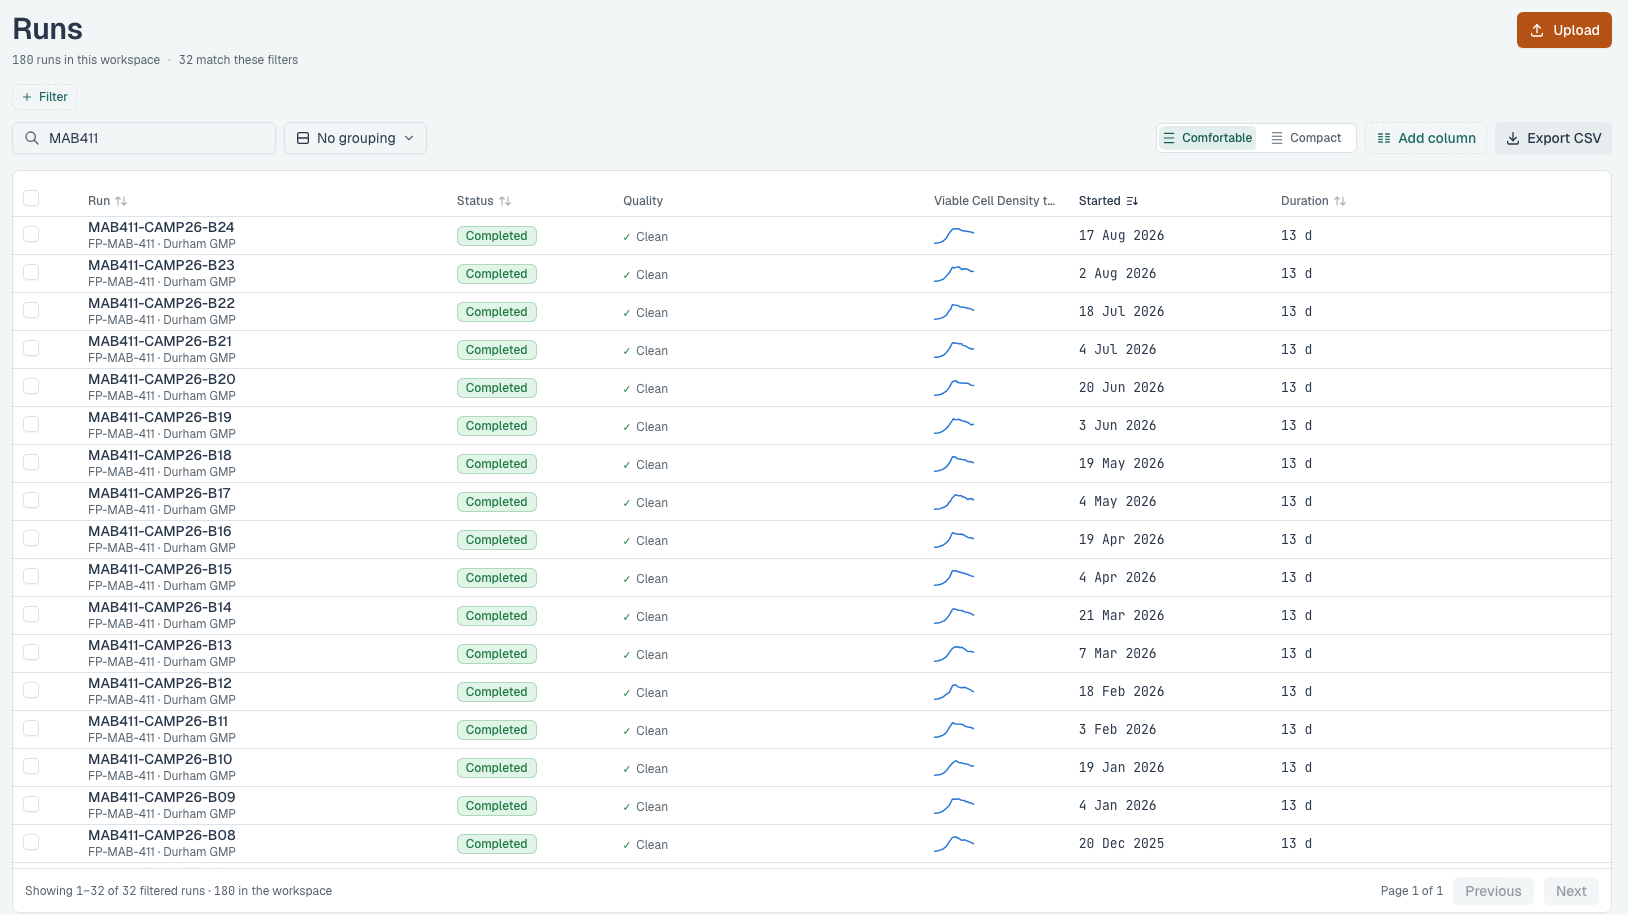
Screenshot detail · Open the full view above
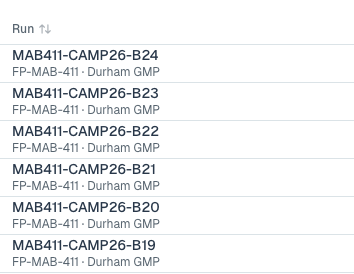
Alpha demo · Synthetic data
From file to finding
Your run data, measurements and comparisons belong in the same workflow.
With an account, upload CSV exports and map columns to metrics and units. Ingestion runs as a background job, and the upload page shows each file’s status.
Explore time-series plots, offline assays and run events.
Build a cohort, align timelines and compare the same metrics. Export the results when you’re ready.
Built around the data
A plot is the beginning. fermPlot keeps the measurements, units, events and curation decisions within reach.
Switch metric presets and use linked cursors. Lay charts out side by side or overlay them. Keep events and process phases in view.
Inspect process measurements alongside sample and assay data, with units and quality flags attached to the values.
With an account, compute derived metrics for a run. The run’s Analysis tab lists each analysis with its method, status and time.
See which measurements are flagged suspect. With an account, mark values suspect or correct them; the original values and each change stay in the curation history.
Map source columns to a metric library so measurements from different files have a common identity.
Export plots and downloadable data bundles, with the context you need to continue your analysis.
See workspace totals for runs, completed runs and recent ingestions, the latest analyses with their warnings, and how your runs break down by program, site and product.
Each workspace keeps its own runs, files and measurements, with viewer, technician, scientist and admin roles.
A few practical details
Have a specific instrument or workflow in mind? Let’s talk
fermPlot ingests CSV exports and supports both time-series process measurements and offline sample and assay data. Source columns map to the metric library and units. Contact us to discuss your instrument’s export format.
Yes. Select up to 12 runs within your workspace, choose shared metrics, align to inoculation, induction or clock time, and review unit compatibility. The cohort summary keeps each run’s context alongside its results.
Yes. The application includes chart exports and downloadable run and comparison bundles. You choose the available components to include in a run export.
fermPlot is in alpha. Open the demo to use a read-only workspace of 180 synthetic bioreactor runs and nine studies, without signing up. To work with your own data, request access. If you already have an account, sign in.
Try fermPlot alpha.